
How to Measure and Improve Performance in .NET
A practical guide to diagnosing and optimising .NET applications in real-world environments.
Introduction
Performance is not an afterthought — it is a necessity. As .NET applications evolve and gain new features, efficiency often degrades, affecting user experience and operational costs.
This article covers:
- What to measure in .NET and why
- Tools for diagnosing bottlenecks
- Patterns and best practices for boosting performance
- Common anti-patterns to avoid
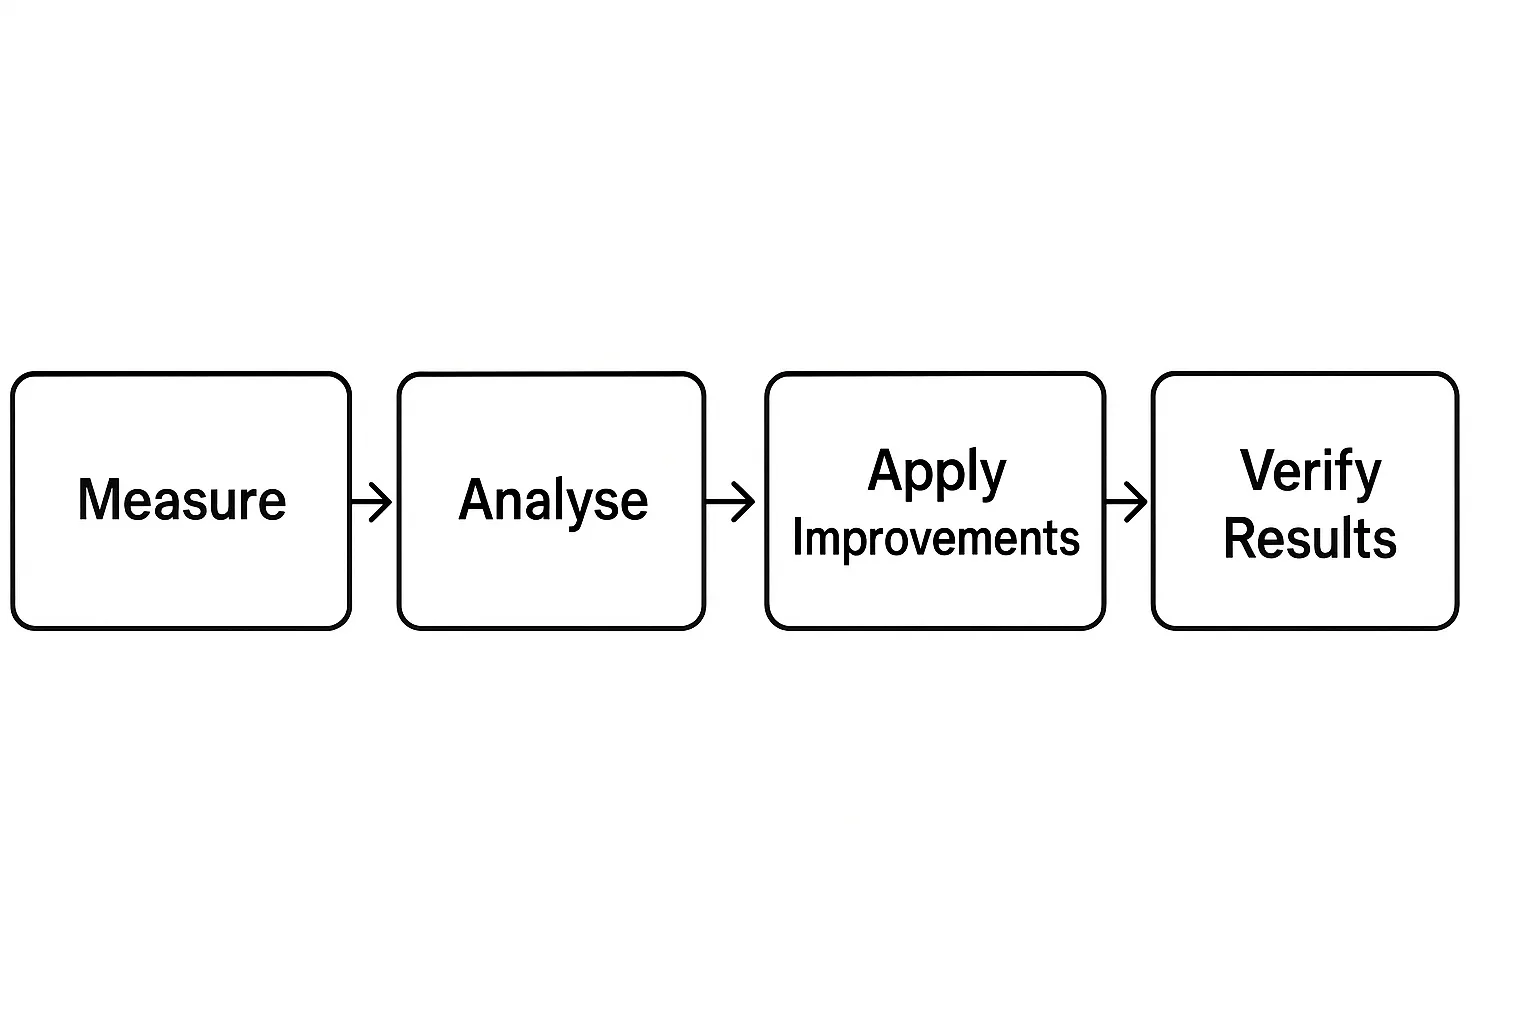
The Diagnosis Workflow
Before making changes, follow a structured approach:
What to Measure in .NET
Focus on metrics that matter:
- Response Time for key operations (API endpoints, critical commands)
- Memory Usage and GC (particularly for long-running services)
- CPU Usage (saturated threads, overused parallelism)
- Database and External Service Latency
- Throughput (requests per second)
Tools for Measuring
-
dotnet-counters:
dotnet-counters monitor -p <PID> -
dotnet-trace:
dotnet-trace collect -p <PID> --providers Microsoft-DotNETCore-SampleProfiler -
BenchmarkDotNet (for measuring critical methods):
[MemoryDiagnoser] public class MyBenchmark { [Benchmark] public void DoWork() => /* logic */; } -
Application Insights / OpenTelemetry: Enables end-to-end visibility in production environments.
-
PerfView: Advanced tool for diagnosing CPU hotspots and GC pressure.
What to Improve in .NET
1. Avoid Unnecessary Allocations
Replace List<T> with Span<T> when processing intensive sequences.
Use StringBuilder for concatenation in critical loops.
Before:
string result = "";
foreach (var item in items) result += item.ToString();
After:
var sb = new StringBuilder();
foreach (var item in items) sb.Append(item);
string result = sb.ToString();
2. Choose the Right Data Structures
Use Dictionary for frequent lookups and ArrayPool<T> for temporary buffers.
3. Reduce Blocking I/O Operations
Switch blocking calls to asynchronous versions and cache frequently used data to reduce external requests.
4. Profile to Eliminate Hotspots
Use profiling tools to detect:
- Methods with long execution times
- Unindexed database queries
- Expensive serialisation and deserialisation
5. Evaluate External Dependencies
Review REST calls and external requests. Can any be replaced by caching or in-memory storage? Can their frequency be reduced?
Common Anti-Patterns
- Premature optimisation — measure first, then optimise.
- Excessive caching — can cause inconsistencies and waste memory.
- Profiling in production environments — may degrade performance if done carelessly.
Case Study
An e‑commerce application suffered rising response times when load increased from 100 to 1,000 requests per second. Diagnosis revealed:
- Costly JSON serialisation
- Unindexed database queries
After applying:
- Serialisation improvements using
System.Text.Json - Adding database indexes
Results:
- Average response times dropped from 450 ms to 130 ms (71%)
- Reduced GC pressure
General Best Practices
- Always measure first — don’t guess.
- Change one variable at a time to measure its impact.
- Maintain performance test coverage to spot regressions.
References for Further Reading
Conclusion
Measuring and improving performance in .NET is about applying a method, using the right tools, and following best practices. By focusing on actionable improvements and verifying their results, you can build .NET applications that are faster, more predictable, and more resilient.